
Monitoring Cluster Status
Visualize cluster costs and savings, and monitor optimization status and weekly performance reports.
Check your cluster’s monthly cost using visualized graphs, and compare pre- and post-optimization values to understand cost-saving effects.
Monitoring Cost Savings and Cluster Status
Checking the Cost Summary Dashboard
In the Overview screen’s Last 30 Days Cost Summary, you can easily compare:
the cost before optimization, cost based on current settings, and estimated cost based on actual usage.
- Before Optimization: Total monthly cost before optimization
- Current Provisioned: Estimated cost based on current settings
- After Optimization: Estimated cost based on Skuber’s recommended optimization
- Actual Used: Estimated cost based on actual usage
Tip Hover over the graph to view detailed figures for each day via tooltips.

Viewing the Cluster List
At the bottom of the Overview page, you can view detailed information about each cluster’s resource state and optimization status.
- Cluster name and status:
- Cost Optimization: Optimization applied
- Original Setting: Default state (not optimized)
- Monthly Cost: Estimated cost based on current settings
- Resource Info:
- CPU Requests (Cores)
- Memory Requests (GiB)
- Monthly Savings: This section shows the estimated monthly savings by comparing the current cluster setting with the optimized setting recommended by Skuber.
- Optimization Toggle: Turn it on to apply the recommended setting. The status will update accordingly.
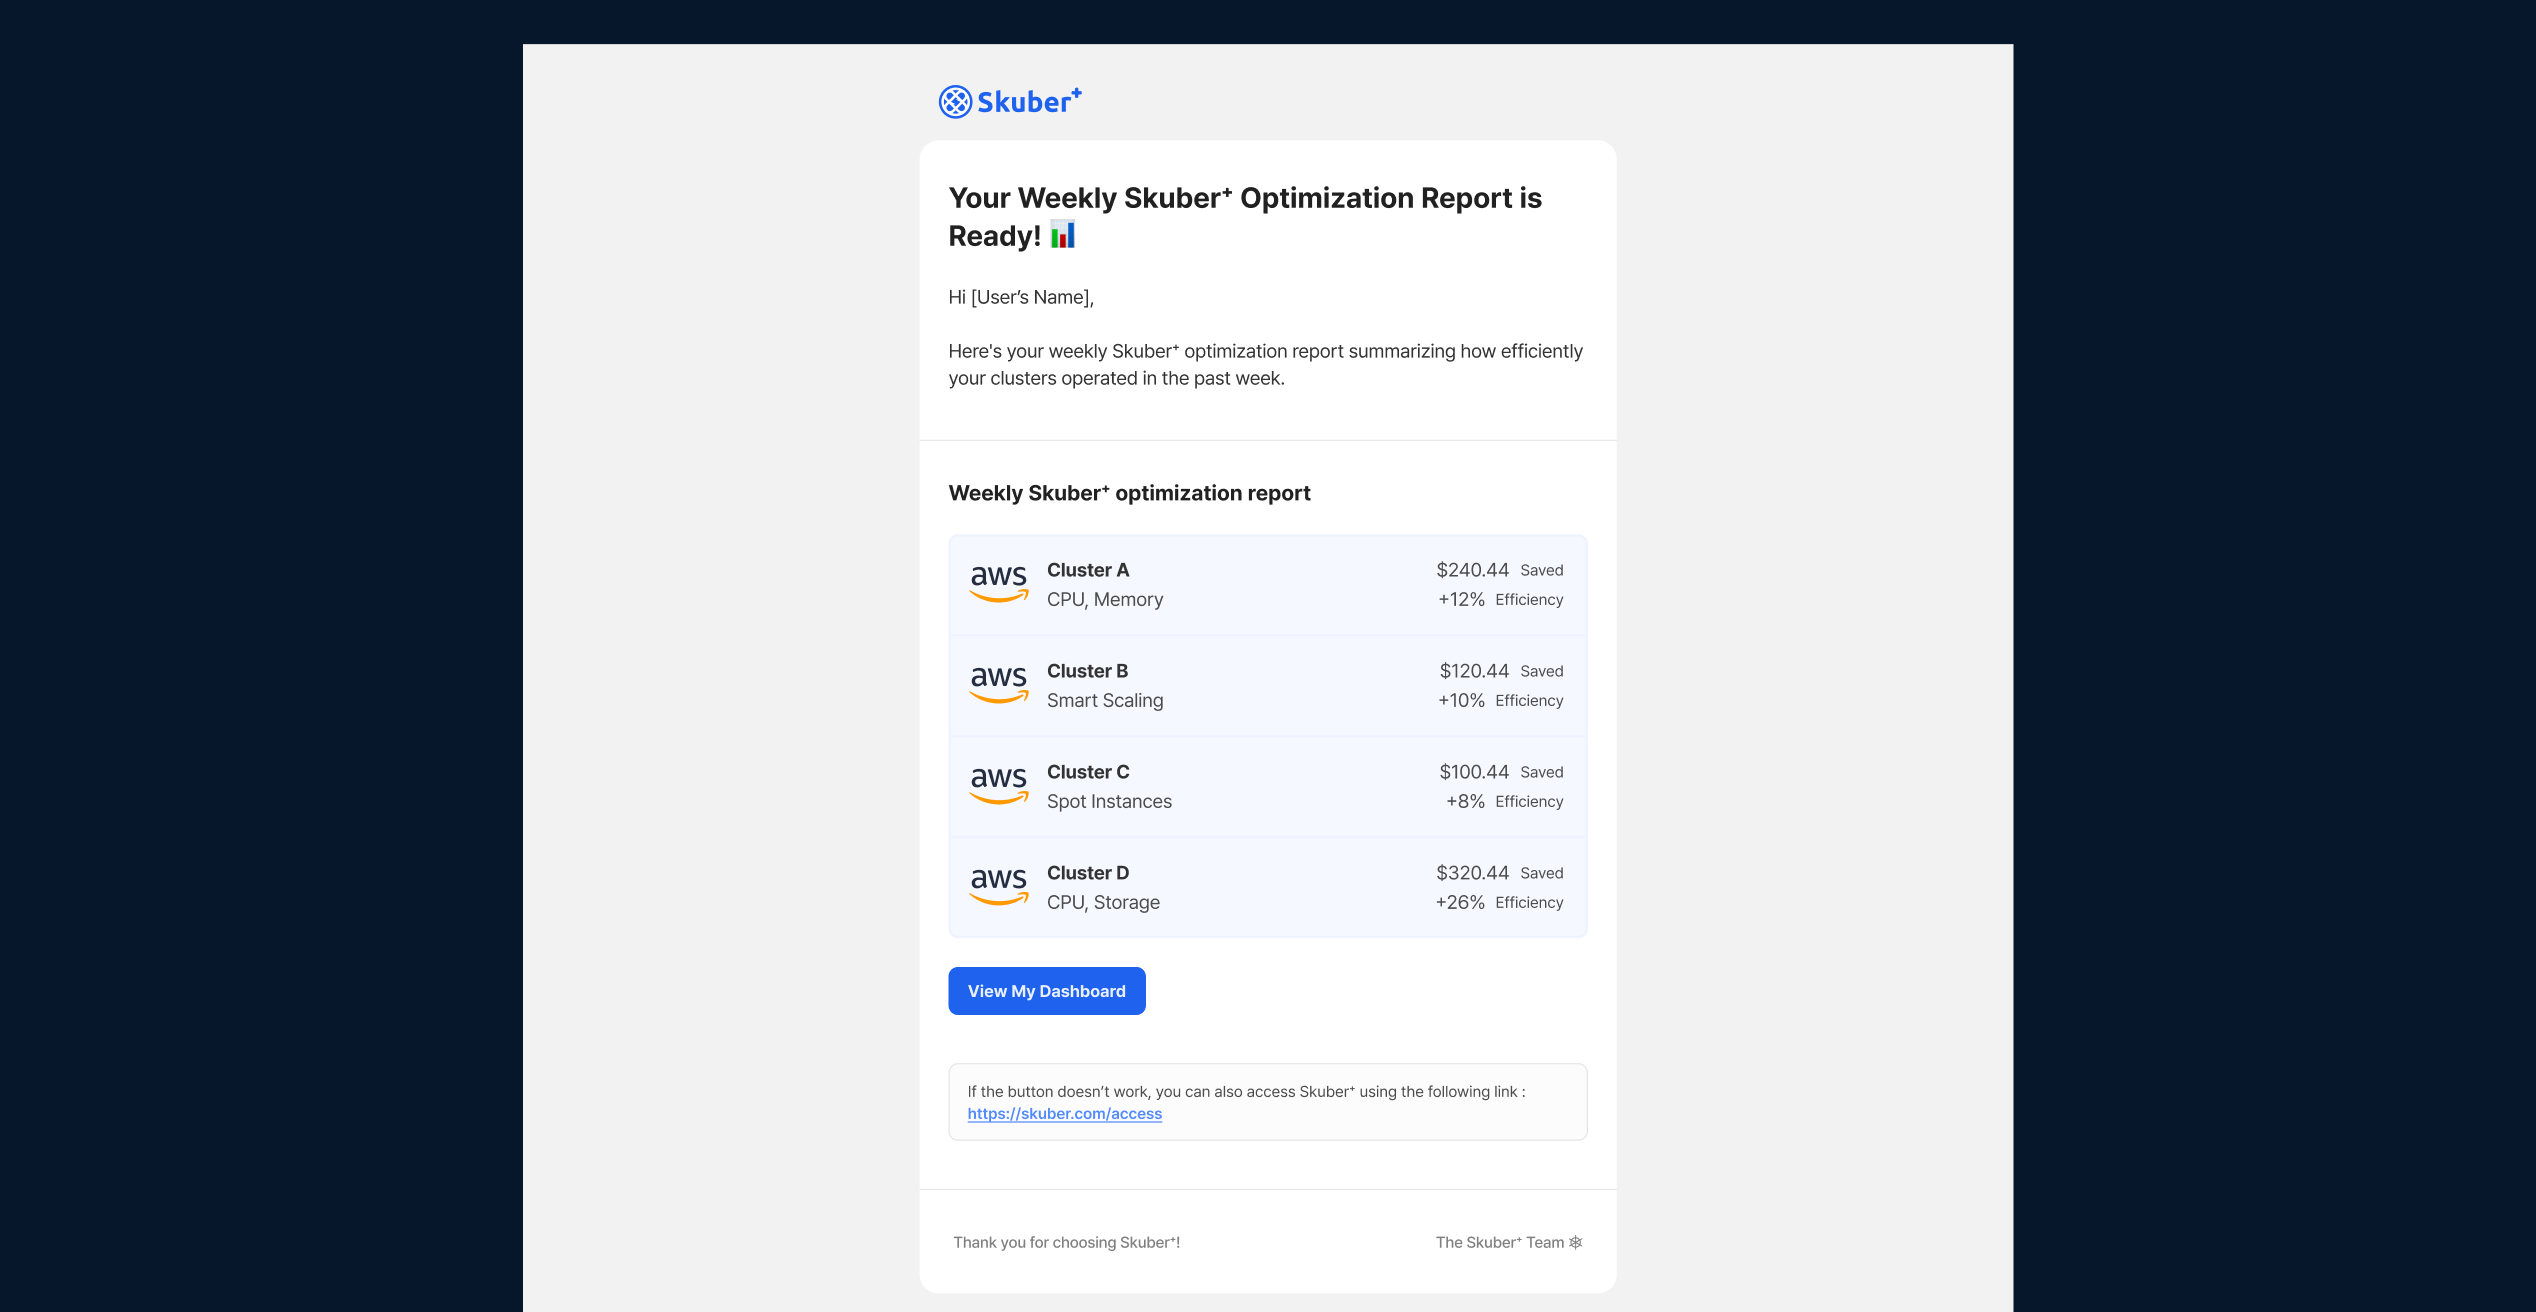
Receiving Weekly Report Emails
Weekly email reports analyze your cluster's operational efficiency and cost savings.
You can easily check the improvement rate and reduced cost per cluster.
Tip Enable email notifications to receive key insights at a glance, such as savings metrics.
This feature is enabled by default.


Skuber⁺ helps you manage and optimize EKS without the hassle.